
I love the studies carried out over 110 years ago by Starch & Elliott (1912, 1913a, 1913b). In short, they tested the reliability of English teachers grading papers (1912), and got disastrous results showing an absurd amount of variation in scores across many teachers. Then, they did a second study with geometry teachers (1913), got even greater variation of scores, and finally did a third study with history teachers, essentially replicating the results from the other two.
I often cite these when talking shop, saying something like “we’ve known for 100 years that grading can be incredibly unreliable,” but recently I revisited these foundational studies, and now have an even greater appreciation for their design and findings. In this blog post, I’ll dig into these groundbreaking studies, starting with the 1912 edition…
The English One
Starch & Elliott (1912) gave two different students’ papers to 142 high school English teachers to grade. These teachers all taught 9th grade English, and were each from a different school. The researchers gave teachers the student papers (i.e., Paper A, and Paper B), and the exam questions, which they show in their published study. I especially love how they also gave teachers the answers. Why do I love this? Even with just one set of answers provided to each teacher, the results showed a massive range of scores (see below). That is, individual teacher interpretation of clearly-defined criteria can still wreak havoc on grading. Here are the ranges of scores that were returned to the researchers:
| 142 English Teachers | |
| Paper A | 64-98 |
| Paper B | 50-98 |
That’s…ridiculous! In the case of Paper B, we have some teachers failing the student with others giving them a nearly perfect score. Among other things, this is a very good example of the drawbacks of using the 100-point scale. But wait, there’s more! One thing I forgot about was that Starch & Elliott also gave the papers to 86 college students taking an English methods course. Here are those ranges along with the original:
| 142 English Teachers | 86 College Students in English Methods Course | |
| Paper A | 64-98 | 74-99 |
| Paper B | 50-98 | 65-96 |
Sure, the lowest end of scores is about 10 points higher, but these were college students with little to no teaching experience. Now, would you believe that they also gave the papers to professional educators being trained in educational measurement? Yes, yes they did. There were 98 superintendents, principals, and teachers enrolled in a college educational measurement course, and their ranges are added below:
| 142 English Teachers | 86 College Students in English Methods Course | 98 Superintendents, Principals, and Teachers in College Educational Measurement Course | |
| Paper A | 64-98 | 74-99 | 62-99 |
| Paper B | 50-98 | 65-96 | 64-92 |
The range of scores for Paper A was nearly identical between the professional teachers and educators enrolled in the measurement course, and the range of scores on Paper B from educators enrolled in the measurement course was nearly identical to that of the inexperienced college students. Overall, we have 326 individuals in education, with about 75% of them professionals, all following the same trends of wildly interpreting student achievement.
Another gem from the first study was a reference to Jacoby (1910) who conducted a similar study on a much, much smaller scale with just 6 college astronomy professors, giving them each 11 different papers to grade. One odd thing about this is that Jacoby asserts that his findings show little variation, which made its way into Brookhart et al.’s 2016 meta analysis table. Jacoby’s interpretation was that “there is a very close accord in the marks given by the various professors. It would appear that the students have attained a very high average in their work” (p. 819). Yet, this is misleading, and something Brookhart et al. (2016) didn’t seem to dig into like I would have wanted. Jacoby was mainly commenting about the average scores you see in the bottom row of the table below (while excluding Professor D), which are pretty close (i.e., 7.9-8.6), and what misled him into saying scores were consistent. Instead, I invite you to look across the scores for each of the 11 papers (i.e., “Book No.”) to see how much variation there is from one professor to the next:
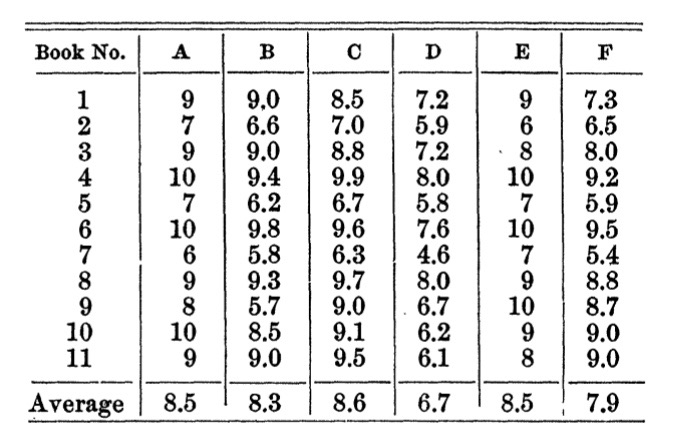
Multiplying these scores by 10 gives us grades on the 100-point scale so we can compare them to the Starch & Elliot studies. Now, variation of professors’ grades across a single paper in Jacoby’s study was an average of 23 points! In the case of papers 2, 5, 7, and 9, those differences meant passing, or failing depending on the professor. The paper with the most variation (#9) ranged 57-100! Again, this is one professor failing the student, and another literally giving them a perfect score?! Even with such a small sample, we see the same kind of range Starch & Elliott found. In case people weren’t convinced of the unreliability of grading, S & E were back at it again the following year…
The Geometry One
The researchers intentionally chose English for their first study thinking its subjective nature would show the most variation. Naturally, they were “urged” (p. 254) by others to repeat the study using an “exact science such as mathematics” (p. 254). In this one, they gave 128 high school geometry teachers—again each one from a different school—a single student’s math paper, the exam questions, and its answers. While you might expect there to be less variation, which certainly must have been true of non-believers at the time, the researchers found more! The scores returned ranged from 24-92. How could this be?! It turns out that not only were some teachers taking points off for math-related stuff, they also took off points for spelling, etc.! This, surely, would add to the mess of grading unreliability. For example, one teacher took off 3 points for “careless make-up” (p. 258), while another took off 13!
Since some papers were returned with scores for each separate question in this study, Starch & Elliott were also interested in how much variation there could be on the individual item level. They found that 49 teachers scoring the same exam question (#10) scored a range of 0-12.5! Therefore, the second study supported the conclusion that grading was astoundingly unreliable across many teachers. While they could’ve walked away then, later that year they rounded things out with a final installment, creating an early trilogy.
The History One
In their final study, Starch & Elliott gave a student’s history paper, exam questions, and its answers to 122 high school history teachers, each from their own school. Results from this last study fall between the first two, with the scores ranging 43-92. It’s starting to sound like old news, right? This study also had a recommendation about using a smaller scale to reduce variability and error, such as the one I advocate for (i.e., 55, 65, 75, 85, 95, 100).
The Point?
While there are a number of takeaways from these groundbreaking, foundational studies, the main point would be…to stop using points!—especially 100 of them—to report student achievement. Over the three studies, Starch & Elliot sampled the grading reliability of 576 educators, both practicing and pre-service, in both high school and college contexts. The similar ranges of scores shows the ridiculous unreliability of grading, and provides damning evidence against the use of the 100-point scale.
References
Brookhart, S. M., Guskey, T. R., Bowers, A. J., McMillan, J. H., Smith, J. K., Smith, L. F., Stevens, M. T., & Welsh, M. E. (2016). A Century of Grading Research: Meaning and Value in the Most Common Educational Measure. Review of Educational Research, 86(4), 803–848. https://doi.org/10.3102/0034654316672069
Jacoby, H. (1910). NOTE ON THE MARKING SYSTEM IN THE ASTRONOMICAL COURSE AT COLUMBIA COLLEGE, 1909-10. Science (New York, N.Y.), 31(804), 819–820. https://doi.org/10.1126/science.31.804.819
Starch, D., & Elliott, E. C. (1912). Reliability of the Grading of High-School Work in English. The School Review, 20(7), 442–457. https://www.jstor.org.silk.library.umass.edu/stable/1076706
Starch, D., & Elliott, E. C. (1913a). Reliability of Grading Work in Mathematics. The School Review, 21(4), 254–259. https://www.jstor.org.silk.library.umass.edu/stable/1076246
Starch, D., & Elliott, E. C. (1913b). Reliability of Grading Work in History. The School Review, 21(10), 676–681. https://www.jstor.org.silk.library.umass.edu/stable/1076951

Fantastic article, thank you!
Yours,
Richard